模型的可解释性之SHAP
大模型开发/技术交流
- LLM
5天前59看过
SHAP(SHapley Additive exPlanations)[1] 是由华盛顿大学研究人员于2017年在NIPS会议提出。它与之前的LIME都是采用局部近似方法,不同的是,SHAPE用线性模型的系数估计Shapley值解释模型,而LIME在输入点附近近似模型行为。
SHAP原理介绍
要理解
SHAP的运作原理,首先要从博弈论中著名的Shapley值讲起。Shapley值最初用于衡量多人合作中各自的“贡献”,计算每个参与者对最终成果的影响。SHAP方法的名字正是由此而来。在机器学习模型中,Shapley值变成了各个特征对预测结果的“贡献值”。
Shapley值的计算公式
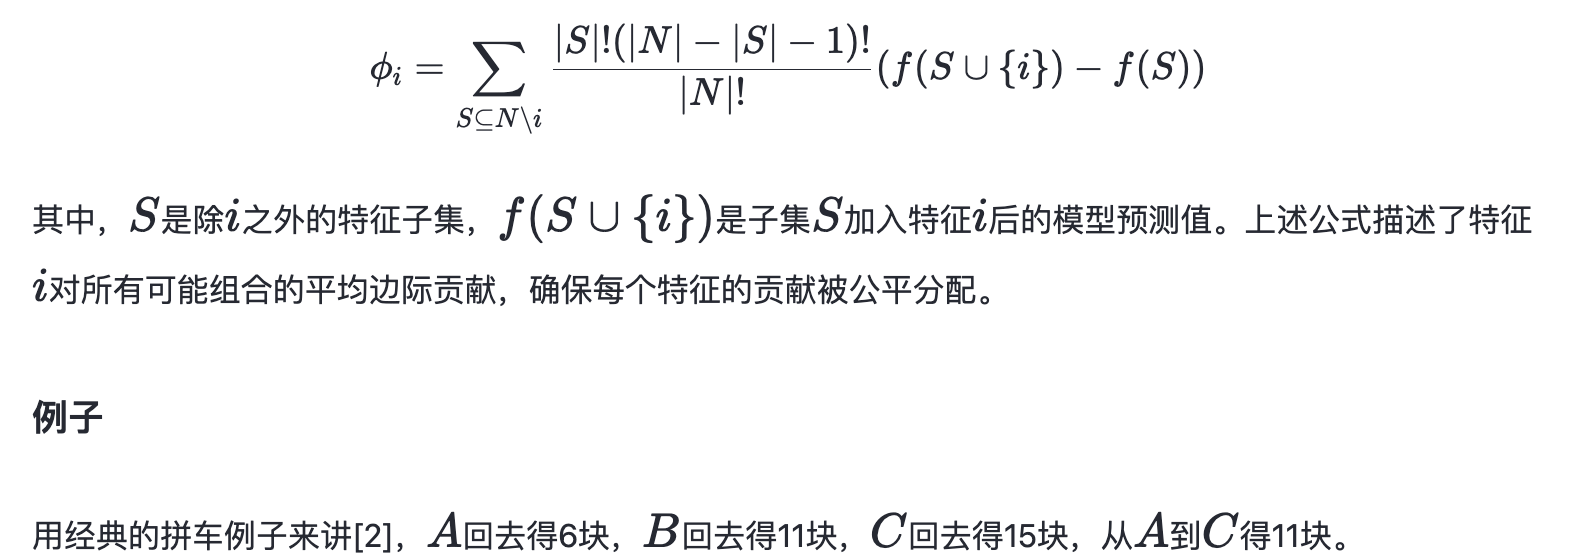
Shapley值的核心思想是基于边际贡献的公平分配:假设每个特征是一个"玩家",我们想知道如果让不同的玩家参与这个预测游戏时,每个特征对最终结果的平均贡献是多少。假设总计NNN个特征,特征iii的Shapley值可以如下表示:


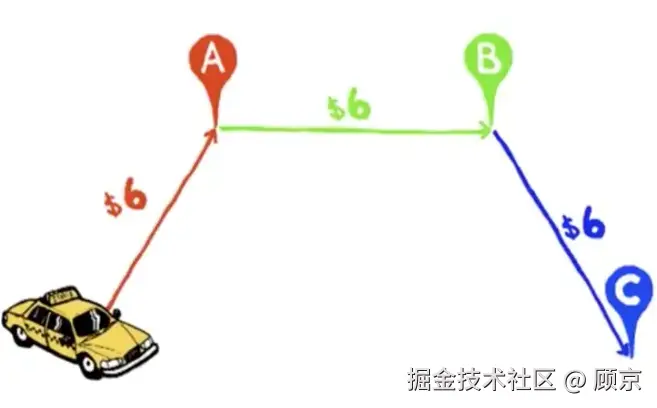
现在AA, BB, CC三人在一块,那各分摊多少合适呢?
我们可以去计算AA, BB和CC三人对路费的平均边际贡献,即
Shapley值。如何计算呢?

图2 路费分摊案例
对图2进行简单说明,以情况5为例,CCC打车回去,15块,路上遇到AAA,绕路送AAA回去,再回家要6+11=17块,故而AAA出2块;再遇到BBB,送AAA回去后,绕路送BBB回去,CCC共出18块,除掉AAA的2块,故而BBB分摊1块。
综上,通过计算
Shapley值,路费分摊就是小case了。
SHAP使用案例
UCI心脏病数据集介绍
该数据集收集了来自多个医疗机构的患者信息,旨在帮助研究人员和数据科学家开发预测心脏病发作风险的模型。该数据集包括了如下特征,
-
Age,年龄
-
Sex,性别
-
Chest Pain Type,胸痛类型
-
Resting Blood Pressure,静息血压
-
Serum Cholesterol,血清胆固醇
-
Fasting Blood Sugar,空腹血糖
-
Electrocardiogram Results,心电图特征
-
Maximum Heart Rate,最大心率
-
Exercise Induced Angina,运动诱发的心绞痛
-
ST Depression During Exercise,运动时的心电图ST 段压低
-
ST Slope,心电图ST波峰值的坡度
-
Number of Major Vessels,主血管数量
-
Thalassemia,是否患有地中海贫血症
-
Target,是否患有心脏病
SHAP关于UCI心脏病数据集
我们使用
sklearn中决策树模型根据实例的特征来预测心脏病是否发作。
首先,对数据进行预处理,并拟合决策树模型。
heart_disease_uci= pd.read_csv('UCI_data/heart_disease_uci.csv')heart_disease_uci= heart_disease_uci.drop(['id', 'dataset'], axis= 1)# apply function on column 'num'heart_disease_uci['num']= heart_disease_uci['num'].apply(lambda x: 1 if x!= 0 else 0)# cholesterol, 胆固醇; fasting_blood_sugar, 空腹时是否血糖高; rest_ecg, 静息时心电图特征; angina, 心绞痛; st_depression, 心电图中ST段压低; st_slope, 心电图中ST波峰值的坡度;# num_major_vessel, 心脏附近主血管数目; thalassemia, 是否患有地中海贫血症; target, 是否心脏病;heart_disease_uci.columns= ['age', 'sex', 'chest_pain_type', 'resting_blood_pressure', 'cholesterol', 'fasting_blood_sugar','rest_ecg', 'max_heart_rate_achieved', 'exercise_induced_angina', 'st_depression', 'st_slope', 'num_major_vessels','thalassemia', 'target']# convert to dummiesheart_disease_uci= pd.get_dummies(heart_disease_uci)heart_disease_uci= heart_disease_uci.dropna()# split datasetX= heart_disease_uci.drop('target', axis= 1)y= heart_disease_uci['target']X_train, X_test, y_train, y_test= train_test_split(X, y, test_size= 0.2, random_state= 1206)# train modelmodel= DecisionTreeClassifier()model.fit(X_train, y_train)
接下来,对单个预测进行解释,如图3所示。
exper= shap.TreeExplainer(model)# shap_vales, [The contribution of the features of each instance to predicting class0, The contribution of the features of each instance to predicting class1];shap_vales= exper.shap_values(X_test)# visualize a single prediction,# SHAP force oriented graph, which intuitively displays how the predicted results of a single# sample are obtained by the combined contribution of various features.# expected_value, Traverse all samples in the training set, make predictions for each sample,# and then add up all predicted values and divide by the number of samples to# obtain the average predicted value, which is called expected-value.# shap_vales, The contribution of each feature to the model's prediction results.shap.force_plot(exper.expected_value[1], shap_vales[1][1, :], X_test.iloc[1, :])
其中,
shap_values函数用于计算特征的对各个类别的平均边际贡献;shap.force_plot送入expected_value,即预测各类别平均值,特征对各个类别的平均边际贡献值和单个测试实例。
图3 单个实例的SHAP势导图
如图3所示,可以看到非地中海贫血,心电图ST段的值等特征有力的引导模型预测其患有心脏病。
我们也可以用
shap.force_plot绘制多个实例的势导图,如图4所示。
# visualize many predictionsshap.force_plot(exper.expected_value[1], shap_vales[1][:60, :], X_test.iloc[:60, :])

图4 多个实例的SHAP势导图
图4横坐标对应单个实例,纵坐标对应模型预测值,鼠标移动上去,就会详细显示单个实例各个特征对模型预测的贡献。
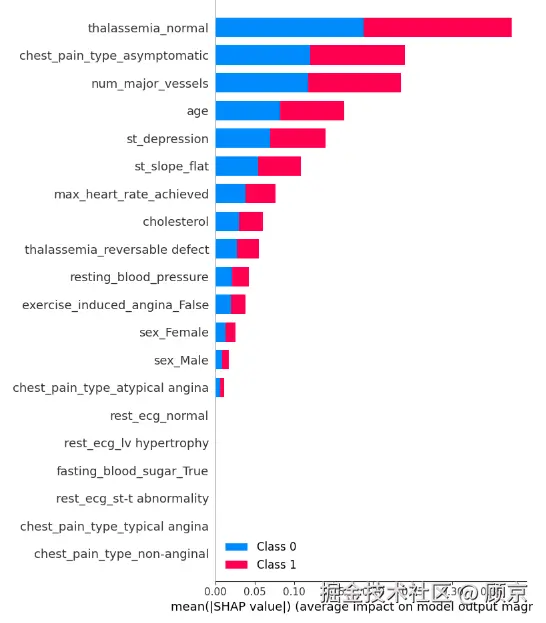
当然,我们也可以从整个数据集角度看,分析各个特征对预测类别的重要性。
# The behavior of the model on the entire test dataset, as well as the importance and direction of# influence of each feature on the model output.shap.summary_plot(shap_vales, X_test)

图5 特征对各个类别的贡献
SHAP关于MNIST手写数字集
SHAP不仅可以分析传统机器学习模型,也可以分析深度学习模型。下面我们定义一个简单的卷积网络,并用SHAP工具解释模型的行为。
class Net(nn.Module):def __init__(self):super().__init__()self.cv= nn.Sequential(nn.Conv2d(in_channels= 1, out_channels= 16, kernel_size= 3, stride= 1, padding= 1),nn.ReLU(),nn.MaxPool2d(kernel_size= 2, stride= 2),nn.Conv2d(in_channels= 16, out_channels= 32, kernel_size= 3, stride= 1, padding= 1),nn.ReLU(),nn.MaxPool2d(kernel_size= 2, stride= 2))self.fc= nn.Sequential(nn.Flatten(),nn.Linear(32* 7* 7, 128),nn.ReLU(),nn.Linear(128, 10))def forward(self, x):return self.fc(self.cv(x))
跳过训练的过程,下面代码是创建了一个解释器,并对测试图片进行解释。
images, labels= next(iter(valid_loader))background= images[ :124]test_images= images[124:]exper= shap.DeepExplainer(net, background)shap_vales= exper.shap_values(test_images)# shap_vales[i], explanation of the classification of models into category i.print(f'len of shap_vales: {len(shap_vales)}, shape of shap_vales[0]: {shap_vales[0].shape}')
注意,这里的解释器要传入
background,这是因为它会在背景数据集上采样,计算每个输入特征在不同特征组合下的边际贡献,然后对这些边际贡献进行加权平均,得到每个特征的 Shapley 值。下面是可视化的代码,图6是可视化的结果。
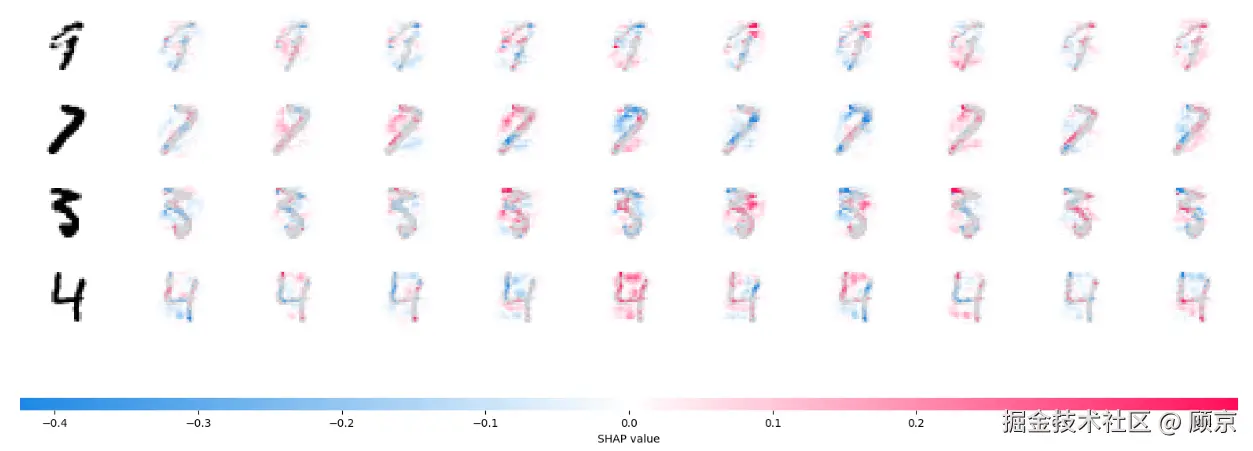
# viewtest_images= torch.permute(test_images, (0, 2, 3, 1))shap_vales= [np.transpose(s, (0, 2, 3, 1)) for s in shap_vales]shap.image_plot(shap_vales, -test_images.numpy())

图6 卷积网络预测结果的SHAP解释
如图6所示,第一列是原图,第二到十一列是各个类别特征的
SHAP值。红色表示正向贡献,红色表示负向贡献。
完整代码
完整代码见我的github.
Reference
————————————————
版权声明:本文为稀土掘金博主「顾京」的原创文章
原文链接:https://juejin.cn/post/7432233100233867327
如有侵权,请联系千帆社区进行删除
评论
